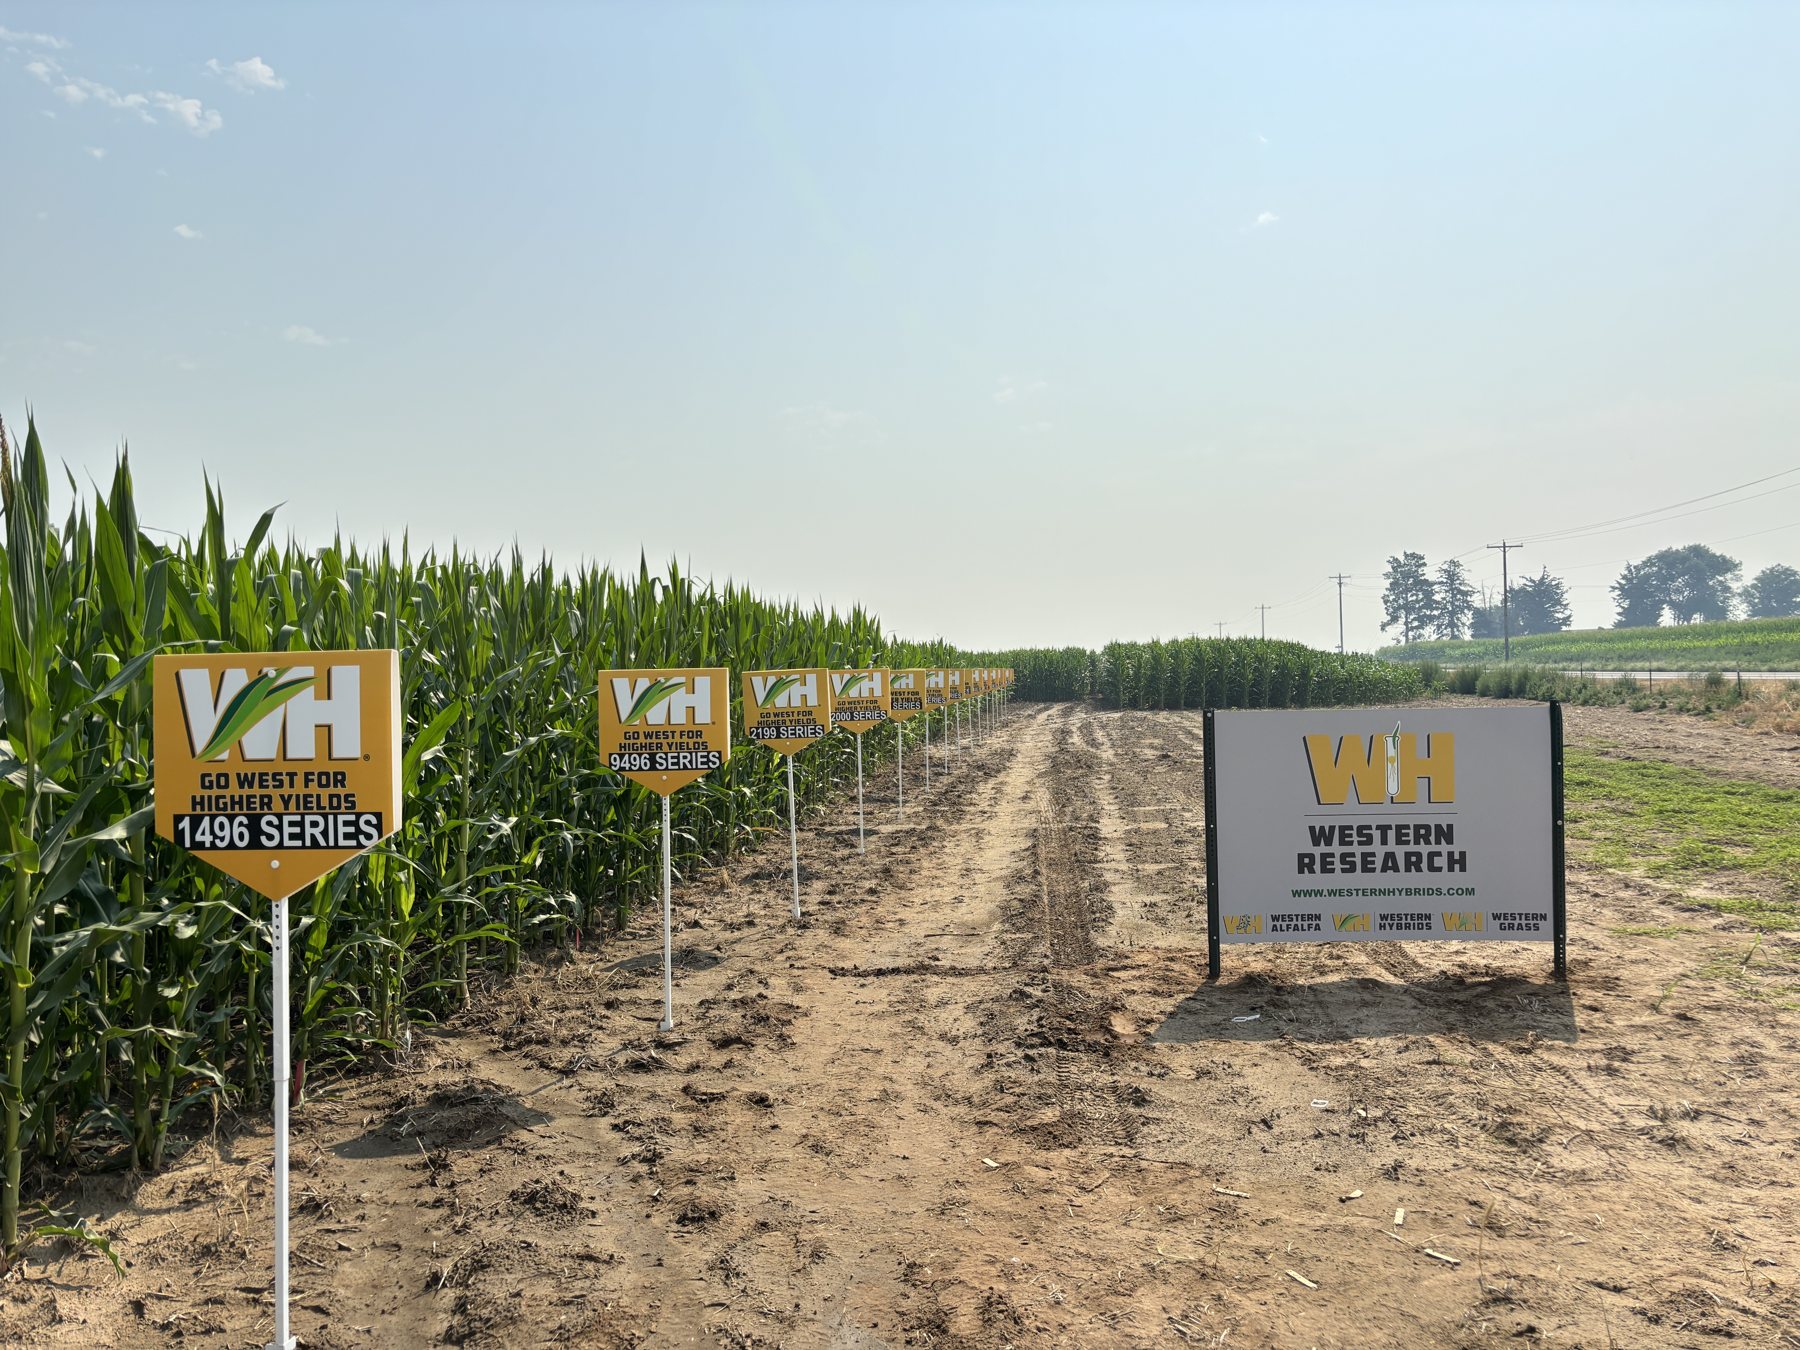
Research
Thirty-three planned locations.
One standard.
Every year we start with 308 hybrids. Fewer than 10% advance to another year of data collection before they ever reach the farm.
The funnel
308 in. Fewer than 10% forward.
A hybrid does not get into the bag because it looked good once. It gets there by surviving years of western data.
Where we test — 2026
The map for this season
Thirty‑two corn hybrid trial sites are on the ground for 2026, planted between 8 April and 29 May across Idaho, Washington and Utah — plus three forage trials: alfalfa in southern Utah, timothy in the Columbia Basin and a forage trial at Malin, Oregon now in its second year.
Select a pin to explore a trial site, or open the map's sidebar to browse locations. Open the map in a new tab if it does not load here.
Idaho
22- Canyon7
- Twin Falls4
- Cassia3
- Gooding2
- Jerome2
- Bonneville1
- Payette1
- Power1
- Washington1
Washington
9- Grant3
- Adams2
- Yakima2
- Benton1
- Franklin1
Utah
1- Iron1
Forage
3- Iron, UT1
- Franklin, WA1
- Klamath, OR1
The interactive map is maintained by Jonathan Shurtliff and reflects the active 2026 research locations. Thirty‑three corn locations were planned for the season; thirty‑two corn sites are planted and mapped, alongside three forage trials.
How a trial is planted
Every site, the same grid
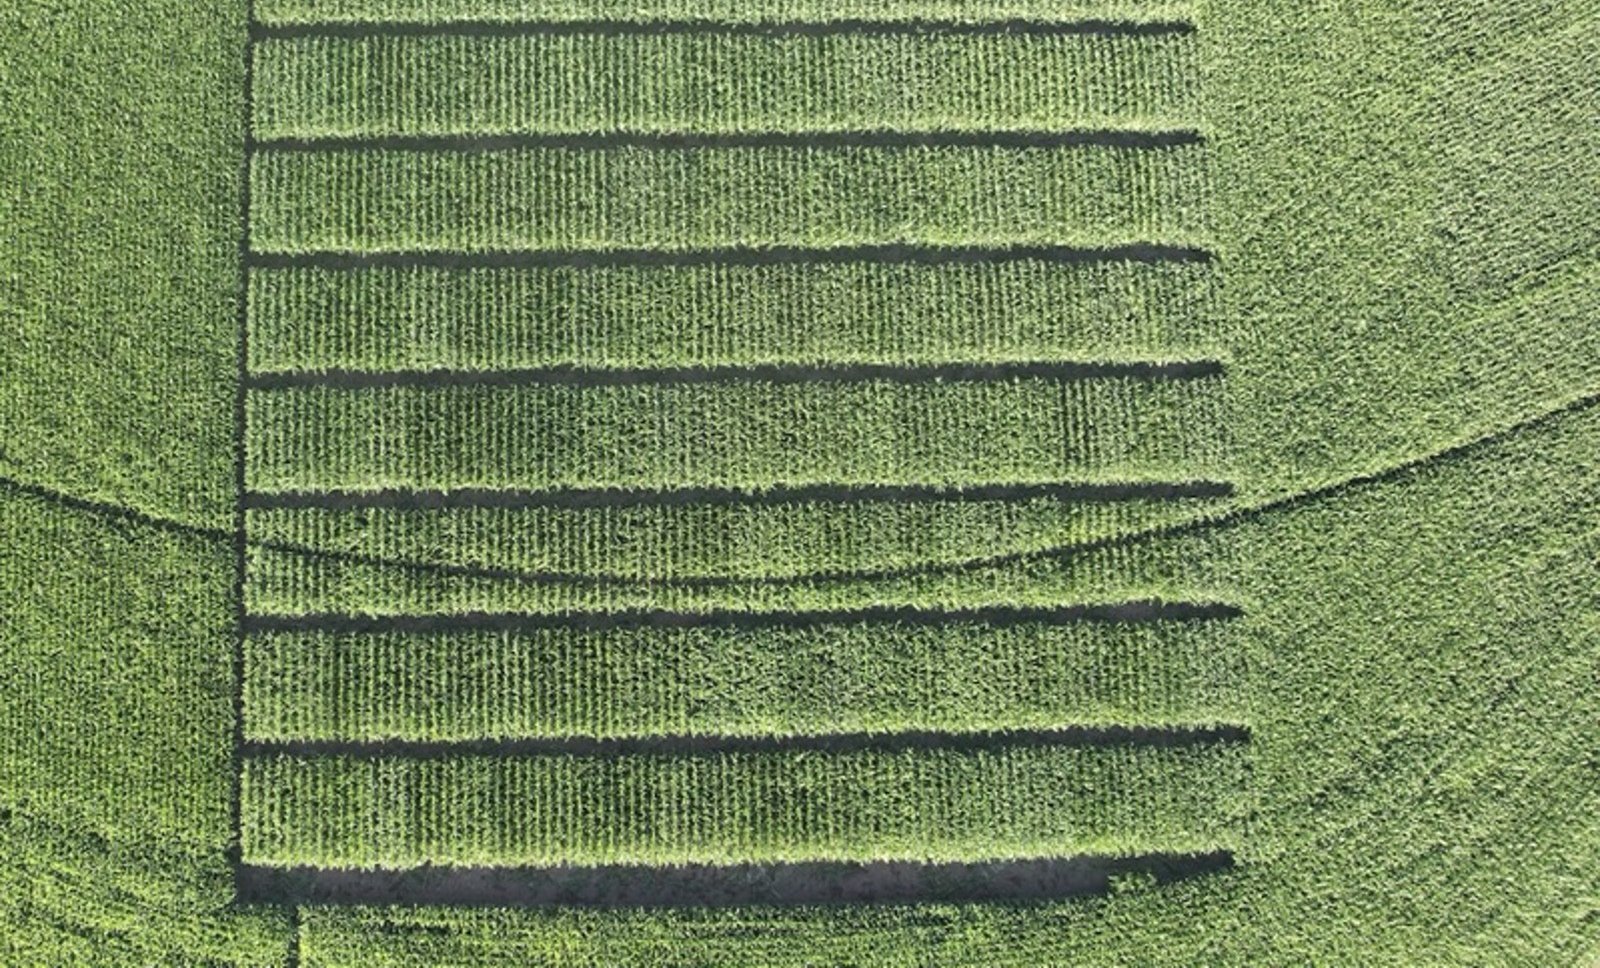
One design runs across all thirty‑two corn locations: nineteen ranges randomized at every site, bordered on all sides, with commercial check hybrids planted in the same field and under the same water as our own entries.
every site
the 2026 maps
median 475
test this year
- Western Hybrids entry under test
- Commercial check hybrid
- Seed treatment comparison
- Fill or border plot
Randomized at every site
Nothing inherits an advantage from a good end of a field. No hybrid sits in the same position twice.
Bordered and filled
Perimeter ranges and edge plots are planted to fill. No test plot competes against open ground on an outside edge, which is where a lot of plot data quietly goes wrong.
Checks in the same field
Commercial standards at five relative‑maturity bands — roughly 83, 94, 101, 106 and 115 day — are planted in thirty‑one of the thirty‑two trials, so the comparison is made on the same ground in the same season.
Conventional screened too
Seventy-one of this year’s entries are conventional, and 237 are traited, for a total of 308. Two locations are given over to conventional screening rather than mixing it in with traited material.
A seed treatment block
Ten sites carry a thirty‑plot seed treatment comparison — six treatments, five replications each — planted inside the same trial so the seed, the soil and the water are held constant.
Forage on the same discipline
The Malin, Oregon forage trial runs 198 test plots — 64 treatments at three replications, alfalfa and grass together — inside a planted border. The southern Utah alfalfa trial runs 101 test plots at three replications, and the Columbia Basin timothy trial runs 75 plots across fifteen varieties, comparing coated against raw seed.
Layout and counts taken from the 2026 active research trial maps. Cooperators are not named and entry identities are not published — ask your territory manager for the data behind any hybrid in the lineup. The 15,938 figure counts plots on the trial maps; the 18,562 figure elsewhere on this site counts seed packets and plots together.
Why it matters
Western data beats a Midwest recommendation
Tested and proven to give the best results in our environment — not a recommendation from a Midwest-focused brand.
A hybrid that tops a trial in Illinois has told you something about Illinois. Our program exists so that the number you are shown was earned on ground that looks like yours.
- Data collected in the western states, on western irrigation and elevation.
- Multi-year screening — one good season is not a result.
- Rejection is the point: fewer than 10% move forward.
- Your rep can walk you through the data behind any hybrid we sell.
Want to see the numbers?
Ask your territory manager for the trial data behind any hybrid, variety or mix in the lineup.